目录
导航计时(Navigation Timing)
一图胜千言
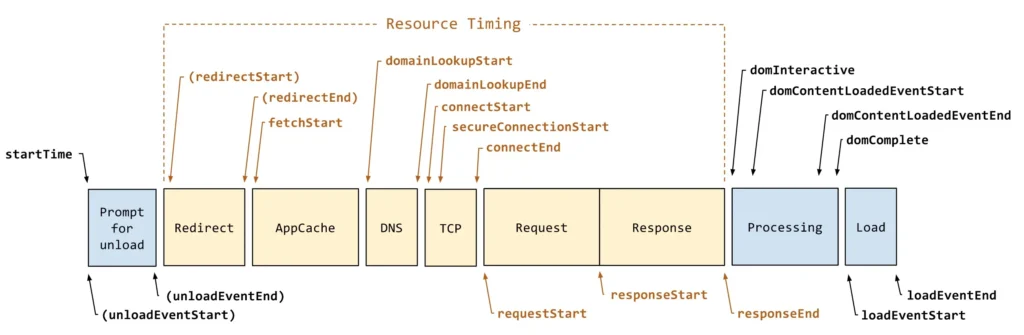
网页加载各阶段计时字段说明
| 字段 | 描述 | 计算方式 | 备注 |
|---|---|---|---|
| unload | 前一个页面卸载耗时 | unloadEventEnd – unloadEventStart | 前一个页面卸载时可能监听了 unload 做些数据收集,会影响页面跳转 |
| redirect | 重定向耗时 | redirectEnd – redirectStart | 过多重定向影响性能 |
| appCache | 缓存耗时 | domainLookupStart – fetchStart | |
| dns | DNS 解析耗时 | domainLookupEnd – domainLookupStart | |
| tcp | TCP 连接耗时 | connectEnd – connectStart | |
| ssl | SSL 安全连接耗时 | connectEnd – secureConnectionStart | 只在 HTTPS 下有效 |
| ttfb | Time to First Byte(TTFB),网络请求耗时 | responseStart – requestStart | |
| response | 数据传输耗时 | responseEnd – responseStart | |
| dom | 可交互 DOM 解析耗时 | domInteractive – responseEnd | Interactive content |
| dom2 | 剩余 DOM 解析耗时 | domContentLoadedEventStart – domInteractive | DOMContentLoaded 所有DOM元素都加载完毕(除了 async script) |
| DCL | DOMContentLoaded 事件耗时 | domContentLoadedEventEnd – domContentLoadedEventStart | document.addEventListener(‘DOMContentLoaded’, cb) |
| resources | 资源加载耗时 | loadEventStart – domContentLoadedEventEnd | 完整DOM(DOMContentLoaded)到资源加载完毕(window.onLoad)时间 |
| onLoad | onLoad事件耗时 | loadEventEnd – loadEventStart |
传统自定义关键性能指标
| 字段 | 描述 | 计算方式 | 备注 |
|---|---|---|---|
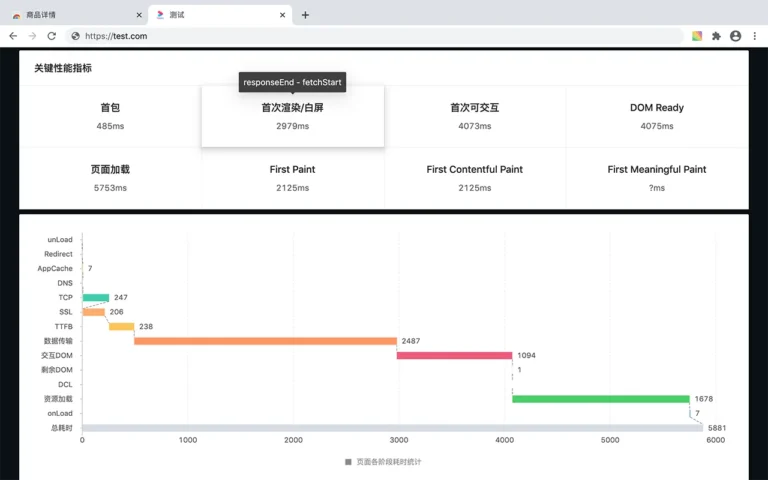
| firstbyte | 首包时间 | responseStart – domainLookupStart | |
| fpt | First Paint Time, 首次渲染时间 / 白屏时间 | responseEnd – fetchStart | 从请求开始到浏览器开始解析第一批 HTML 文档字节的时间差 |
| tti | Time to Interact,首次可交互时间 | domInteractive – fetchStart | 浏览器完成所有 HTML 解析并且完成 DOM 构建,此时浏览器开始加载资源 |
| ready | HTML 加载完成时间, 即 DOM Ready 时间 | domContentLoadedEventEnd – fetchStart | 如果页面有同步执行的 JS,则同步 JS 执行时间 = ready – tti |
| load | 页面完全加载时间 | loadEventStart – fetchStart | load = 首次渲染时间 + DOM 解析耗时 + 同步 JS 执行 + 资源加载耗时 |
格外提一下小程序
| 字段 | 描述 | 计算方式 | 备注 |
|---|---|---|---|
| fpt | First Paint Time, 首次渲染时间 | onShow (first page) – onLaunch (app) | 小程序从 onLaunch 到第一个页面 onShow 之间的时间 |
计时 API
传统 Navigation Timing API
使用方法
计算主页面
const t = performance.timing;

const pageloadtime = t.loadEventStart - t.navigationStart,
  dns = t.domainLookupEnd - t.domainLookupStart,
  tcp = t.connectEnd - t.connectStart,
ttfb = t.responseStart - t.navigationStart;计算页面资源
const r0 = performance.getEntriesByType('resource')[0];

const loadtime = r0.duration,
  dns = r0.domainLookupEnd - r0.domainLookupStart,
  tcp = r0.connectEnd - r0.connectStart,
ttfb = r0.responseStart - r0.startTime;注意事项:
获取主页 html 数据,应该使用 performance.timing,而不是 performance.getEntriesByType(‘resource’)[0]。
performance.getEntriesByType(‘resource’) 表示当前 HTML 文档中引用的所有静态资源信息,不包括本身 HTML 信息。
如果当前不包含任何静态资源那么 performance.getEntriesByType(‘resource’) === [] 使用 [0].xx 会报错。
2、计算静态资源使用 getEntriesByType(‘resource’) 代替 getEntries()
getEntries() 包含以下六种类型
- navigation
- resource
- mark
- measure
- paint
- frame
在比较老的浏览器中,getEntries() 通常情况下一般只有 resource 类型等同于 getEntriesByType(‘resource’)。
因为 navigation 是 Navigation Timing 2 规范,老的浏览器不支持。而 mark 和 measure 是 User Timing 用户自定义类型。
最后两个对于目前(2020年) 来说实现的浏览器就更少了。
所有使用 getEntries() 来检索静态资源都需要过滤其他几种类型,getEntriesByType(‘resource’) 就很明确。
3、secureConnectionStart 问题
secureConnectionStart 用来测量 SSL 协商 所花费的时间,可能有三种值
- undefined,浏览器不支持该属性;
- 0,未使用 HTTPS;
- timestamp 时间戳,使用了 HTTPS
chrome 很老的版本有一个 bug,当获取资源复用了已建立的 HTTPS 信道时,secureConnectionStart 设置为 0 了,按标准应该设置为时间戳。
取值时应该避免不支持和未使用的情况
const r0 = performance.getEntriesByType('resource')[0];
if ( r0.secureConnectionStart ) {
  const ssl = r0.connectEnd - r0.secureConnectionStart;
}4、跨域资源设置响应头 Timing-Allow-Origin
获取页面资源时间详情时,有跨域的限制。默认情况下,跨域资源以下属性会被设置为 0
- redirectStart、redirectEnd
- domainLookupStart、domainLookupEnd
- connectStart、connectEnd
- secureConnectionStart
- requestStart
- responseStart
对于可控跨域资源例如自家 CDN,Timing-Allow-Origin 的响应头 origins 至少得设置了主页面的域名,允许获取资源时间。
一般对外公共资源设置为 Timing-Allow-Origin: *。
对于第三方不可控资源且未设置 Timing-Allow-Origin 头,应该过滤掉这些无效数据。
如果未正确设置 Timing-Allow-Origin 的话
- 未做过滤,那么上报的数据会极大优于用户实际使用情况;
- 做了过滤,那么上了跨域 CDN 的资源也无法上报数据,导致分析不出上了 CDN 的优势。
// Resource Timing
const r0 = performance.getEntriesByType('resource')[0],
  loadtime = r0.duration;

// 只要选取上述一个属性(除了secureConnectionStart)进行判断即可
if ( r0.requestStart ) {
  const dns = r0.domainLookupEnd - r0.domainLookupStart,
    tcp = r0.connectEnd - r0.connectStart,
    ttfb = r0.responseStart - r0.startTime;
}

let ssl = 0; // 默认为 0,当然也可以在数据库层面去做
// 使用了 HTTPS 在计算
if ( r0.secureConnectionStart ) {
  ssl = r0.connectEnd - r0.secureConnectionStart;
}5、注意属性值为 0 的含义
- secureConnectionStart === 0
- 未使用 HTTPS
- 跨域且未设置正确的 Timing-Allow-Origin 时,有若干属性值为 0,参考上述 4
- DNS 解析时间 domainLookupEnd – domainLookupStart === 0
- 和 HTML 同域名下的资源,DNS 时间可能均为 0,因为浏览器会缓存当前解析域名的 IP;
- 浏览器预解析了 DNS 并缓存,<link rel=”dns-prefetch” href=”//cross-domain.com” />。
- TCP 建立连接时间 connectEnd – connectStart === 0
- 例如浏览器与每台主机大概能同时建立 6 个独立的 TCP 连接,那么头 6 个资源的 TCP 非零,剩余的
keep-alive信道复用 TCP 时间为 0
- 例如浏览器与每台主机大概能同时建立 6 个独立的 TCP 连接,那么头 6 个资源的 TCP 非零,剩余的
- SSL connectEnd – secureConnectionStart === 0
- 与 TCP 相同
- 未使用 HTTPS
总之,为零有很多场景,注意区分。
- 不支持
- 未使用
- 复用
- 缓存
- 安全原因不予显示
- …
6、304
很老的 chrome 版本有个 bug,在 200 有 Timing-Allow-Origin 未在 304 时设置,
导致上述很多属性未能设置为时间戳类型而是 0。
那么问题来了
- 你在 #4 中过滤了 304 的情况,只统计了 200 的情况,众所周知 304 缓存技术加载速度优于非缓存的 200。这会拉低的你平均统计性能。
- 如果不过滤,那又会获得比 304 还优的性能统计。
碰到这种情况暂时就没办法区分了,幸运的是 chrome 在 version 37 时修复了。
提示:iframe 与文档环境是相互隔离的,你可以获取 iframe 的 contentWindow.performance 来获取。
现代计时 API
Performance Navigation Timing
替代 performance.timing 的方案,精度高更准确。(但目前兼容性高,仍然可使用,未来可能被废弃)。
使用方法
const pageNav = performance.getEntriesByType('navigation')[0];Performance Navigation Timing 使用了High-Resolution Time,时间精度可以达毫秒的小数点好几位。
{
    "name": "https://developer.mozilla.org/zh-CN/docs/Web/Performance",
    "entryType": "navigation",
    "startTime": 0,
    "duration": 13636.144999996759,
    "initiatorType": "navigation",
    "nextHopProtocol": "h2",
    "workerStart": 0,
    "redirectStart": 0,
    "redirectEnd": 0,
    "fetchStart": 8.684999993420206,
    "domainLookupStart": 8.684999993420206,
    "domainLookupEnd": 8.684999993420206,
    "connectStart": 8.684999993420206,
    "connectEnd": 8.684999993420206,
    "secureConnectionStart": 8.684999993420206,
    "requestStart": 15.749999991385266,
    "responseStart": 10650.364999994054,
    "responseEnd": 13565.22999999288,
    "transferSize": 56666,
    "encodedBodySize": 56127,
    "decodedBodySize": 207120,
    "serverTiming": [],
    "workerTiming": [],
    "unloadEventStart": 10659.469999998691,
    "unloadEventEnd": 10659.5299999899,
    "domInteractive": 13574.969999986934,
    "domContentLoadedEventStart": 13612.624999994296,
    "domContentLoadedEventEnd": 13612.629999988712,
    "domComplete": 13635.66999998875,
    "loadEventStart": 13635.704999993322,
    "loadEventEnd": 13636.144999996759,
    "type": "navigate",
    "redirectCount": 0
}新增了不少属性,可以获取更加详细的信息(resource 也一样)。
// Service worker 响应时间
let workerTime = 0;
if (pageNav.workerStart > 0) {
  workerTime = pageNav.responseEnd - pageNav.workerStart;
}

// HTTP header 大小
const headerSize = pageNav.transferSize - pageNav.encodedBodySize;

// 压缩比率,如果是 1 的话,也能说明未开启例如 gzip
const compressionRatio = pageNav.decodedBodySize / pageNav.encodedBodySize;兼容,由于 performance.getEntriesByType(‘navigation’) 取不到并不会报错而是返回空数组。
if (performance.getEntriesByType('navigation').length > 0) {
  // We have Navigation Timing API
}Performance Paint Timing
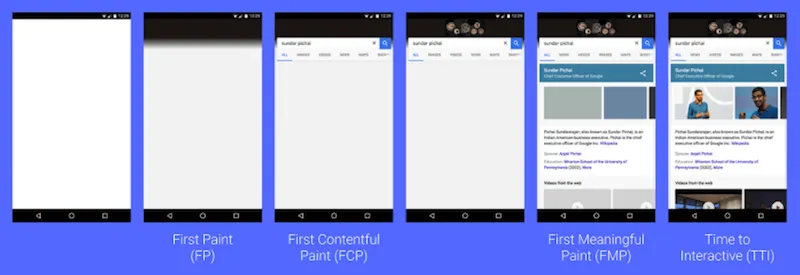
Paint Timing 定义两个重要的新指标:
- 首次绘制 (FP,first-paint) ,浏览器渲染任何在视觉上不同于导航前屏幕内容之内容的时间点。这段时间不就是白屏耗时嘛。
- 首次内容绘制 (FCP,first-contentful-paint),浏览器渲染来自 DOM 第一位内容的时间点。这段时间不就是灰屏耗时嘛。
// 直接在代码里这么用的话,不一定取得到,需要轮询
performance.getEntriesByType('paint');[
{
"name": "first-paint",
"entryType": "paint",
"startTime": 17718.514999956824,
"duration": 0
},
{
"name": "first-contentful-paint",
"entryType": "paint",
"startTime": 17718.519999994896,
"duration": 0
}
]- performance.getEntriesByType 返回的是数组,只有准备好的数据才能入组,你可能需要轮询,或找到一个恰当的时间点来上报数据。
新标准,提供了 PerformanceObserver API 来帮你监听响应的资源数据是否准备好了。
const observer = new PerformanceObserver((list) => {
  for (const entry of list.getEntries()) {
    // `name` will be either 'first-paint' or 'first-contentful-paint'.
    const metricName = entry.name;
    const time = Math.round(entry.startTime + entry.duration);

    collect({
      name: metricName,
      time: time,
    });
  }
});
observer.observe({entryTypes: ['paint'/* , 'navigation', resource */]});使用需要做代码兼容
if ('performance' in window) {
  if ('PerformanceObserver' in window) {
    // todo
  } else {
    // todo
  }
}- 首次有效绘制 First Meaning Paint (FMP):表示当前页面最想展示给用户的元素渲染的时间点,即主元素渲染点。
- FMP 没有标准化的定义,需要开发自己定义。例如元素增速最陡峭的那个时间点。
User timing
用户自定义计时
- performance.mark 打点,参数为点位名称标识
performance.mark('starting_calculations');
const multiply = 82 * 21;
performance.mark('ending_calculations');

performance.mark('starting_awesome_script');
function awesomeScript() {
  console.log('doing awesome stuff');
}
performance.mark('ending_awesome_script');performance.measure 计算,参数为点位名称标识、mark 点位1、mark 点位2
performance.mark('starting_calculations');
const multiply = 82 * 21;
performance.mark('ending_calculations');
+ performance.measure('multiply_measure', 'starting_calculations', 'starting_calculations');

performance.mark('starting_awesome_script');
function awesomeScript() {
  console.log('doing awesome stuff');
}
performance.mark('starting_awesome_script');
+ performance.measure('awesome_script', 'starting_awesome_script', 'starting_awesome_script');取出时间
const measures = performance.getEntriesByType('measure');
measures.forEach(measureItem => {
  console.log(`${measureItem.name}: ${measureItem.duration}`);
});上报数据
一般可以考虑在用户准备卸载页面时上报,毫无疑问这个时间点不会干扰用户在当前页的操作。
但是如果上报耗时很长,会影响用户跳转到下一页的体验。可以使用 navigator.sendBeacon。
传统解决方案,在 unload 中处理
- 因为页面卸载了,就不会关心异步 ajax 的完成接收,所以一般使用同步 ajax 来阻塞页面卸载。
- 创建图片,用 img src 来发送请求。
- setTimeout(ajax, 0)。
navigator.sendBeacon 解决了以上问题
- 页面卸载了,依旧可以异步请求。
- 不阻塞当前页的卸载。
- 使用简单。
不推荐 unload 处理了,如下写法:
// bad
window.addEventListener('unload', function() {
  // 注意 performance.getEntries 会取当前页所有资源包括页面本身的性能信息
  // 注意 数据体量问题
  let rumData = new FormData();
  rumData.append('entries', JSON.stringify(performance.getEntries()));

  // 是否支持
  if('sendBeacon' in navigator) {
    // Beacon 发起请求
    if(navigator.sendBeacon(endpoint, rumData)) {
      // sendBeacon 发送成功
    } else {
      // sendBeacon 发送失败! 使用 XHR or fetch 代替
    }
  } else {
    // sendBeacon 不支持! 使用 XHR or fetch 代替
  }
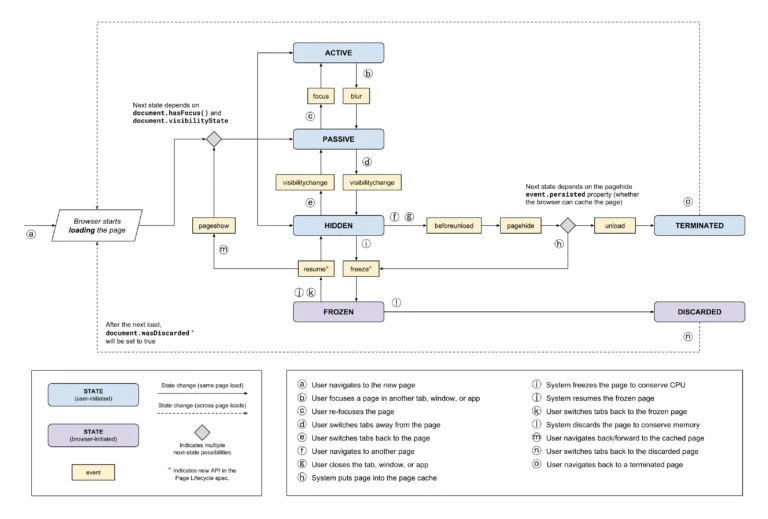
}, false);推荐以下写法,具体原因参考《页面生命周期》
// good
function clear(fn) {
  ['visibilitychange', 'pagehide', 'beforeunload']
    .forEach(event => window.removeEventListener(event, fn, true));
}

function collect() {
  // 注意 performance.getEntries 会取当前页所有资源包括页面本身的性能信息
  // 注意 数据体量问题
  let rumData = new FormData();
  rumData.append('entries', JSON.stringify(performance.getEntries()));

  if('sendBeacon' in window.navigator) {
    if( window.navigator.sendBeacon(endpoint, rumData) ) {
      clear(collect);
    } else {
      // 异步发请求失败
    }
  } else {
    // todo 同步 ajax
    clear(collect);
  }
}

const isSafari = typeof safari === 'object' && safari.pushNotification;
const isIE10 = !('onpagehide' in window);

window.addEventListener('visibilitychange', collect, true);
!isIE10 && window.addEventListener('pagehide', collect, true);

if(isSafari || isIE10) {
  window.addEventListener('beforeunload', collect, true);
}总结
- Navigation Timing 收集 HTML 文档性能指标。
- performance.timing 常用、解决兼容性
- performance.getEntriesByType(‘navigation’)[0] 新标准,精度高内容更详细,兼容性较差
- Resource Timing 收集 HTML 依赖的资源的性能指标,如 CSS、JS、图片、字体等。
- performance.getEntriesByType(‘resource’) 新老一样使用,新标准做了扩展。
- User timing 收集用户自定义
- performance.getEntriesByType(‘measure’) 可以考虑,用来对 FMP 打点。