目录
带着问题思考
带着疑问思考前端性能监控该如何做?
- 开发人员该从哪方面入手改善web应用性能?
- 某某说:优化了性能!问:如何从数据统计上体现?
- 你说的性能优化,真是用户想要的吗?
性能谬见:曾经前端还是个切图仔的简单年代,网页的性能大多简单的以为只是加载时间的问题。如:优化 onLoad 或 DOMContentLoaded 加载时间即可?
真实的用户体验是什么?
| 体验 | 感知 |
|---|---|
| 是否发生? | 导航是否成功启动?服务器是否有响应? |
| 是否有用? | 是否已渲染可以与用户互动的足够内容? |
| 是否可用? | 用户可以与页面交互,还是页面仍在忙于加载? |
| 是否令人愉快? | 交互是否顺畅而自然,没有滞后和卡顿? |
感知定义成确切的关键指标:
| 体验 | 指标 |
|---|---|
| 是否发生? | 首次绘制 (FP)/首次内容绘制 (FCP) |
| 是否有用? | 首次有效绘制 (FMP)/主角元素计时 |
| 是否可用? | 可交互时间 (TTI) |
| 是否令人愉快? | 耗时较长的任务(在技术上不存在耗时较长的任务) |
如何采集计算指标?
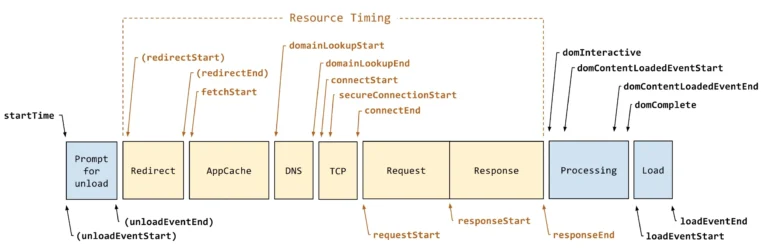
上篇已经指出,这里再次列出需要了解的 API 标准
- Navigation Timing
- PerformanceNavigationTiming
- Resource Timing Level 2
采集的数据分为:
- HTML 自身解析加载过程的数据
- HTML 内联资源加载的信息数据
前端性能监控数据采集分析
API 选择
- 优先使用:
performance.getEntriesByType('navigation')[0],后面简称为 navigation - 不可用时降级处理:
performance.timing,简称 timing
两者区别
- timing 时间属性是以类似 Date.now() 这样的时间戳标识,navigation 是每个页面都从 0 开始计时,精度也更高;
- timing 是 navigationStart 开始,navigation 是以 startTime 开始;
- timing 和 navigationStart 都被新的标准废弃,但兼容较高;
- navigation 新增了资源大小和 serverTiming,可以分析资源是否压缩是否过大过小和离线应用处理时间。
兼容处理
JavaScript
if(window.performance && typeof window.performance.getEntriesByType === 'function') {
  this.resources = window.performance.getEntriesByType('resource');
  this.marks = window.performance.getEntriesByType('mark');
  this.measures = window.performance.getEntriesByType('measure');
  this.timing = window.performance.getEntriesByType('navigation')[0];
  this.paint = window.performance.getEntriesByType('paint');
  this.isSupportRTL2 = true;
} else if(window.performance && typeof window.performance.webkitGetEntriesByType === 'function') {
  this.resources = window.performance.webkitGetEntriesByType('resource');
  this.marks = window.performance.webkitGetEntriesByType('mark');
  this.measures = window.performance.webkitGetEntriesByType('measure');
  this.timing = window.performance.webkitGetEntriesByType('navigation')[0];
  this.paint = window.performance.webkitGetEntriesByType('paint');
  this.isSupportRTL2 = true;
}

this.timing = this.timing || (window.performance && window.performance.timing);关键性能指标计算
JavaScript
let stage = {
  // ...

  // 关键性能指标
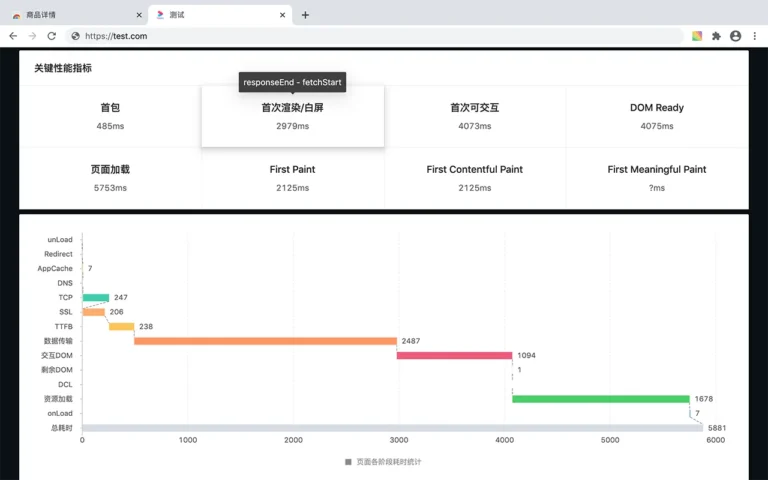
  fb: this.timing.responseStart - this.timing.domainLookupStart, // first byte
  fpt: this.timing.responseEnd - this.timing.fetchStart,         // first paint time 白屏
  tti: this.timing.domInteractive - this.timing.fetchStart,      // 首次可交互
  ready: this.timing.domContentLoadedEventEnd - this.timing.fetchStart,
  load: this.timing.loadEventStart - this.timing.fetchStart,
};

// 传输资源大小,用于判断文件是大小是否合适、是否开启了压缩(如 gzip)
if(this.timing.transferSize !== undefined) {
  stage.transferSize = this.timing.transferSize;       // 文档 + 头部信息大小
  stage.encodedBodySize = this.timing.encodedBodySize; // 压缩文档大小
  stage.decodedBodySize = this.timing.decodedBodySize; // 解压文档大小
}

const [firstPaint, firstContentfulPaint] = this.paint;
if(firstPaint) {
  stage.fp  = firstPaint.startTime;            // 准确的白屏时间
  stage.fcp  = firstContentfulPaint.startTime; // 准确的灰屏时间
}这些数据的作用:
- fb 网络状况怎么样?
- fpt 猜测的白屏时间,有了 paint time 可以获取更精准的白屏、灰屏时间。
- ready DOM解析时间。
- load 首屏资源加载完毕时间。
- 页面传输大小、压缩、解压大小。
- 根据压缩、解压大小判断纯文本类是否开启了http 压缩如Gzip?
- 根据传输大小、压缩大小,看出 header 是否过大?HTML 结构是否过大或过小?

在有了足够的数据支撑后,可以形成每周对比,体现真实的优化效果。
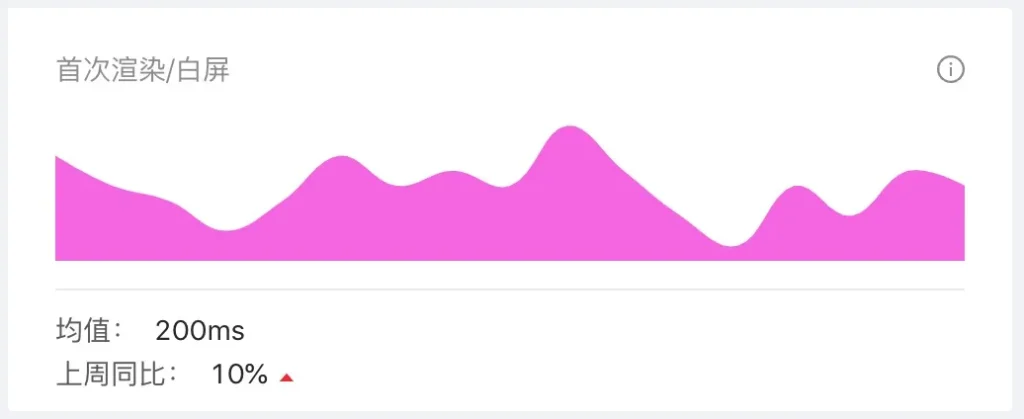
网页加载各阶段耗时统计
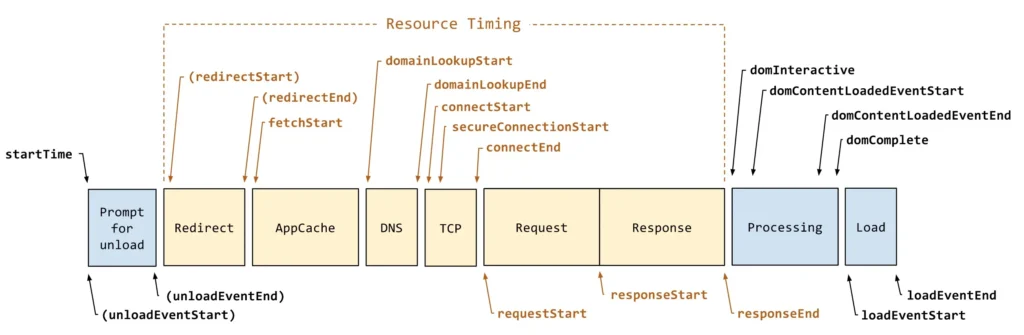
JavaScript
let stage = {
  total: this.timing.loadEventEnd - startTime,
  unload: this.timing.unloadEventEnd - this.timing.unloadEventStart,
  redirect: this.timing.redirectEnd - this.timing.redirectStart,
  cache: this.timing.domainLookupStart - this.timing.fetchStart,
  dns: this.timing.domainLookupEnd - this.timing.domainLookupStart,
  tcp: this.timing.connectEnd - this.timing.connectStart,
  ssl: 0,
  ttfb: this.timing.responseStart - this.timing.requestStart,                // TimeToFirstByte
  response: this.timing.responseEnd - this.timing.responseStart,
  dom1: this.timing.domInteractive - this.timing.responseEnd,                // 可交互 DOM 解析耗时
  dom2: this.timing.domContentLoadedEventStart - this.timing.domInteractive, // DOM 完全加载耗时
  dcl: this.timing.domContentLoadedEventEnd - this.timing.domContentLoadedEventStart,
  res: this.timing.loadEventStart - this.timing.domContentLoadedEventEnd,
  onLoad: this.timing.loadEventEnd - this.timing.loadEventStart,
};

// http 没有 ssl 阶段,https 才有
if(this.timing.secureConnectionStart) {
  stage.ssl = this.timing.connectEnd - this.timing.secureConnectionStart;
}上述数据可以用可视化做成瀑布时序图
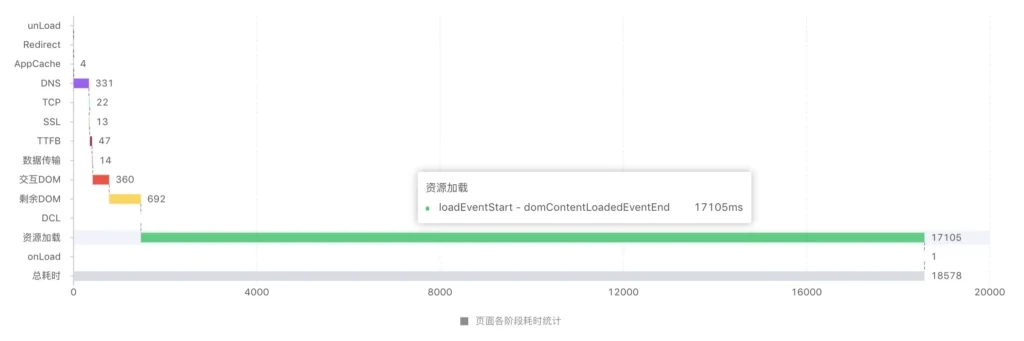
这些数据的作用:
- unload 事件耗时会影响下一个页面的载入时间(ps:移动端对 unload 不太友好)
- redirect 是否设置太多重定向了,能否减少优化
- DNS 为什么总是那么长,http DNS 能搞吗?
<link rel="dns-prefetch" href="cdn.xx.com" />加了吗? - TTFB 首包耗时总那么长,能根据地区如省份,加 CDN 优化吗?
- DOM 解析脚本执行过长,是否考虑时间切片,频繁触发重排了吗?
- 资源加载过多过长,是否压缩了文本类资源?图片优化了吗如 webp?非首屏的延迟加载做了吗?http 缓存开了吗?
- …
FMP 咋搞?
可以考虑如在 react 某个生命周期打点
JavaScript
// DOM 解析第一道脚本开始手动打点
performance.mark('starting_calculations');

// 主角开始加载中...

performance.mark('ending_calculations');
performance.measure('FMP', 'starting_calculations', 'ending_calculations');网页资源加载情况分析
API:performance.getEntriesByType(‘resource’)
JSON
{
  "name": "https://www.bilibili.com/gentleman/polyfill.js?features=Promise%2CObject.assign%2CString.prototype.includes%2CNumber.isNaN",
  "entryType": "resource",
  "startTime": 214.5700000692159,
  "duration": 27.78000000398606,
  "initiatorType": "script",
  "nextHopProtocol": "http/1.1",
  "workerStart": 0,
  "redirectStart": 0,
  "redirectEnd": 0,
  "fetchStart": 214.5700000692159,
  "domainLookupStart": 214.5700000692159,
  "domainLookupEnd": 214.5700000692159,
  "connectStart": 214.5700000692159,
  "connectEnd": 214.5700000692159,
  "secureConnectionStart": 214.5700000692159,
  "requestStart": 220.7000000635162,
  "responseStart": 239.71500003244728,
  "responseEnd": 242.35000007320195,
  "transferSize": 350,
  "encodedBodySize": 72,
  "decodedBodySize": 72,
  "serverTiming": [],
  "workerTiming": []
}有哪些数据可以利用
- name:域名和尾缀归类域名
- initiatorType:结合 name 的尾缀归类资源
- 加载耗时 duration 和文件大小
- startTime、responseEnd 算出并发和总消耗
- 当然同页面也可以收集 DNS、TCP、TTFB 等
首屏资源分析(首屏的含义:加载完毕后获取的资源不归类在首屏)
JavaScript
// 轻微延迟 100ms
this.resources
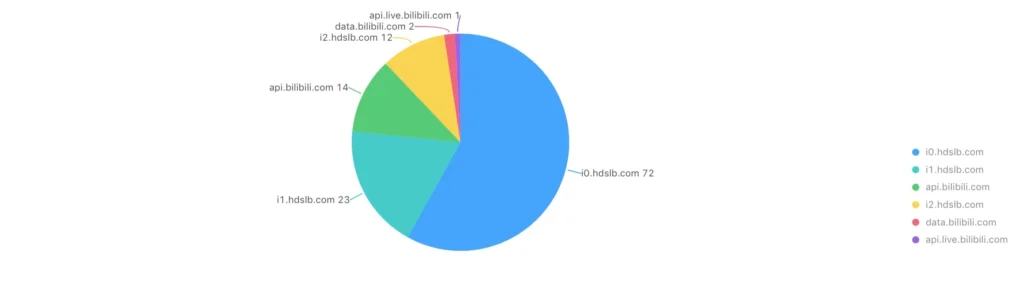
.filter(({startTime}) => startTime < this.timing.loadEventEnd + 100)域名分析
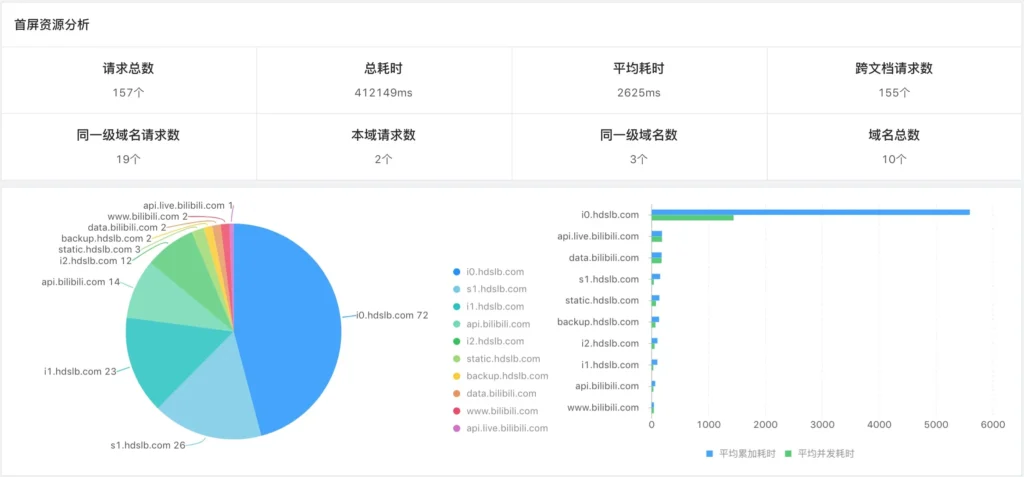
数据有什么用
- 资源域名分类清晰
- 各域名下的加载耗时一目了然
- 自家域名耗时严重,CDN地理位置问题?还是配置问题?
- 意外引用第三方很容易拖垮自家应用,考虑替换?
- 合作第三方资源使用有问题?能否要求对方优化?
可以定义一些公司可控域名,就可以分类本域(host)、公司可控(own)、第三方(external)
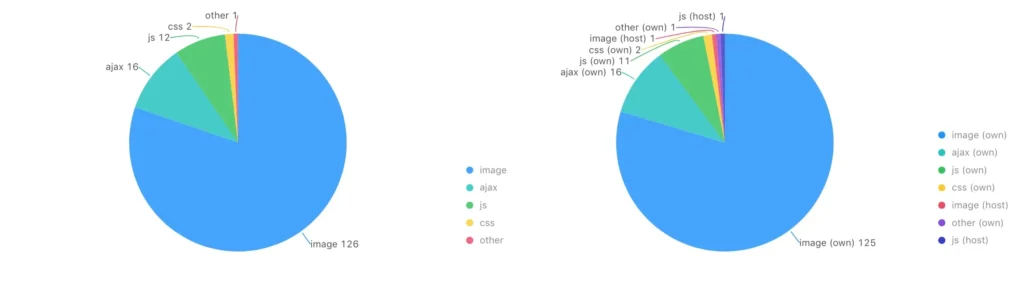
网站资源类型分析
主要可以方便展示网页是属于哪种类型,例如图片还是视频网站,方便针对性优化。
根据 initiatorType 划分
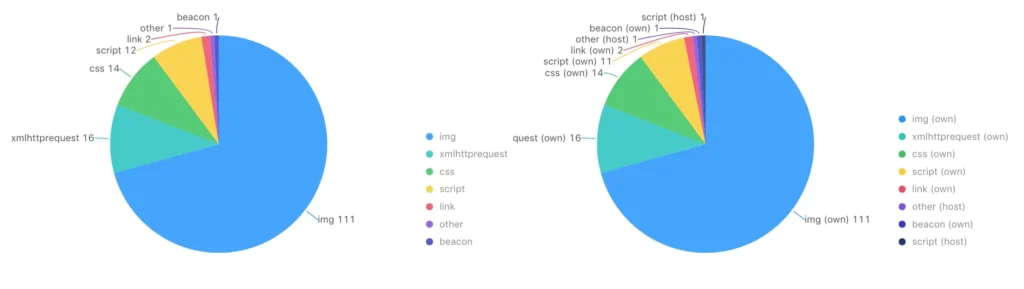
initiatorType 划分有时并不清晰,根据文件尾缀和 MIME 划分
资源跨域分析
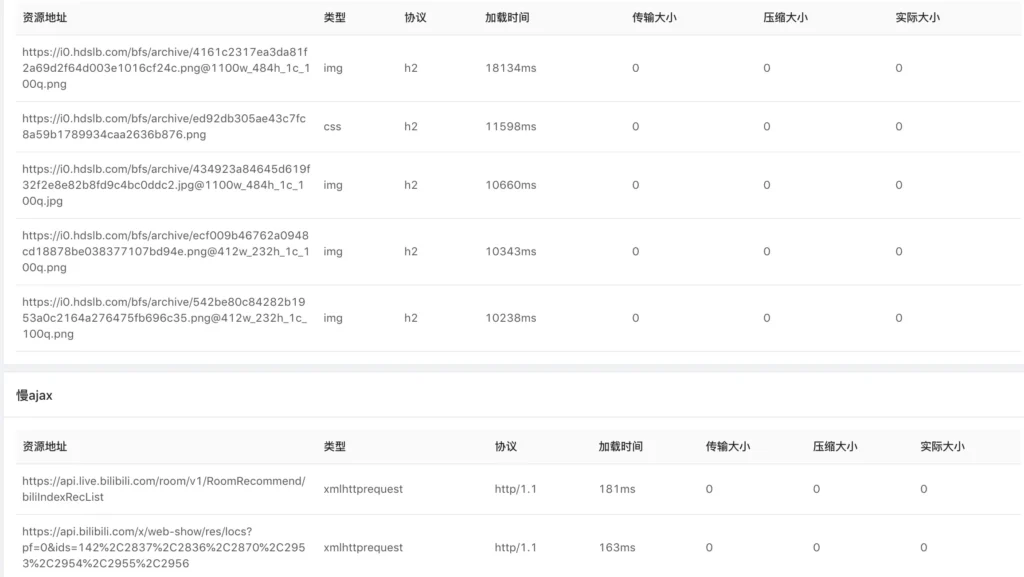
跨域且 Time-Allow-Origin 未配置,这会影响你对资源例如 DNS等收集。
跨域 Time-Allow-Origin 不对,浏览器处于安全置为 0
- redirectStart、redirectEnd
- domainLookupStart、domainLookupEnd
- connectStart、connectEnd
- secureConnectionStart
- requestStart
- responseStart
受限与采集信息的大小,适量上报一些慢资源信息
注意:
- name 小心处理,可能有些上报使用 img.src 导致该值特长,有可能会拖累你的采集性能。
- 上面可以看出,基本都未设置跨域,导致资源大小都为 0。
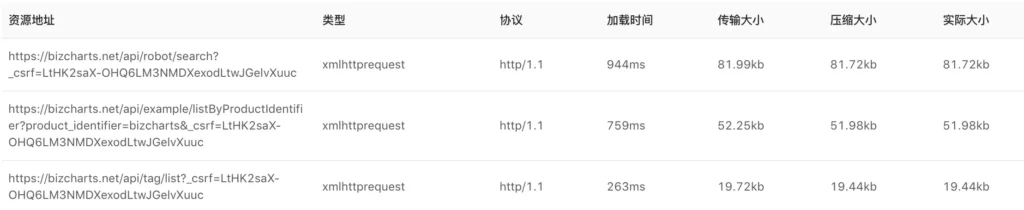
资源未开启压缩分析
尽量能开启压缩的资源都进来压缩,节省用户加载网络资源大小,提升加载速度。
上报
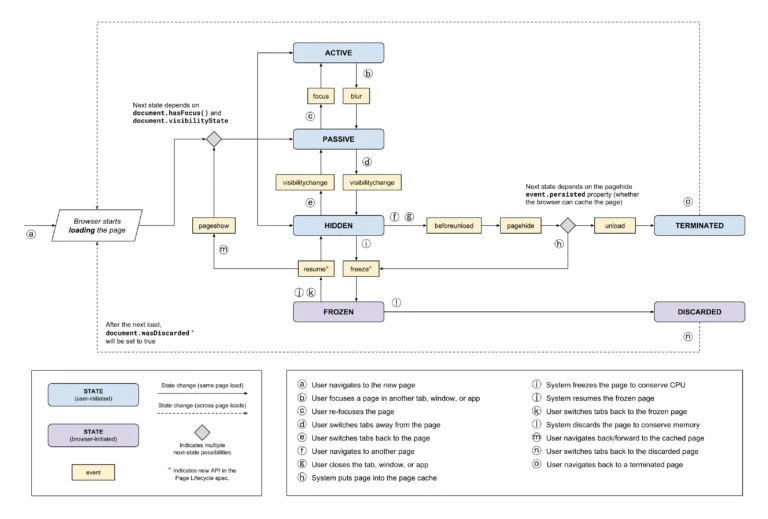
这块同样可以参考:《网页生命周期》
- 时机点:onLoad?unload?visibilitychange?
- onLoad 会干扰用户
- unload 移动端不友好
- visibilitychange 采纳
- 上报方式
- img.src 可能量会超 url 限制,还影响为处理上述的 name。
- ajax 复杂了点儿,要么手写要么引入第三方库。
- 选择 visibilitychange + navigator.sendBeacon + 兼容同步ajax
- 幸存者偏差,可能用户环境特别糟糕,等了很久,还没显示有用信息或可以交互,就被关掉了,那么这时是没有采集到的。可以利用 visibilitychange 上传 performance.now() 收集用户跳出时间。
总结
优化无止境
- 关键性能指标根据业务加权平均,计算应用满意度,不断朝着满意度优化;
- 业务够多铺的够广针对省份优化,选择 CDN 等;
- 优化数据与业务效应对比,优化最终目的是为了留住吸引客户,为个人或公司带来经济效益。